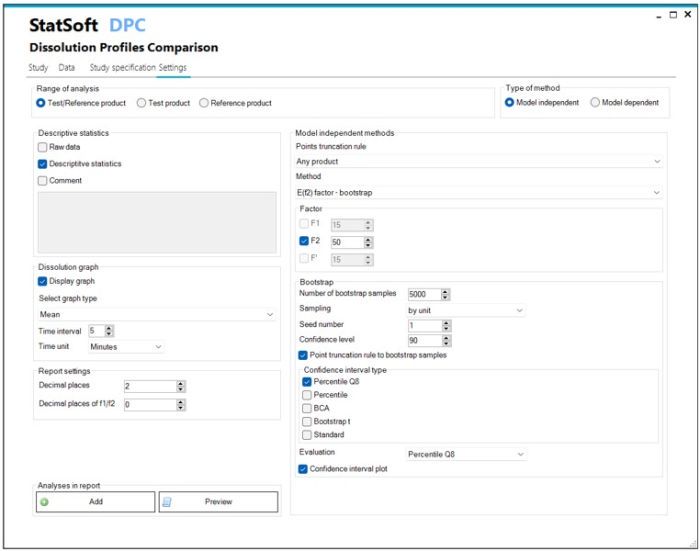
 DPC Dissolution Profiles Comparison is a software designed for evaluation of the similarity between dissolution profiles.
The application allows:
- selection of an appropriate profile comparison method for a given case,
- standardization of the performed statistical analyzes and interpretation of the results,
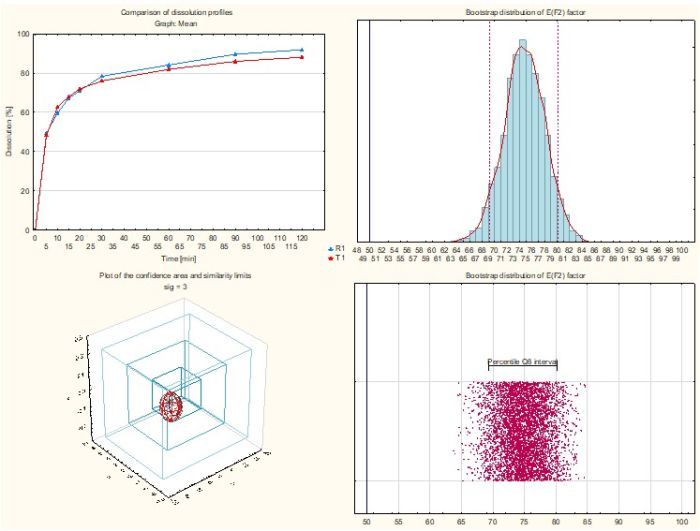
- automatic report generation in tabular and/or graphical form for submission of registration documentation.
All you need is to enter the data and press a button to get a full report in the form of a Microsoft Word or PDF document. The report includes results of the statistical analyses and comments to facilitate the interpretation of the obtained results.
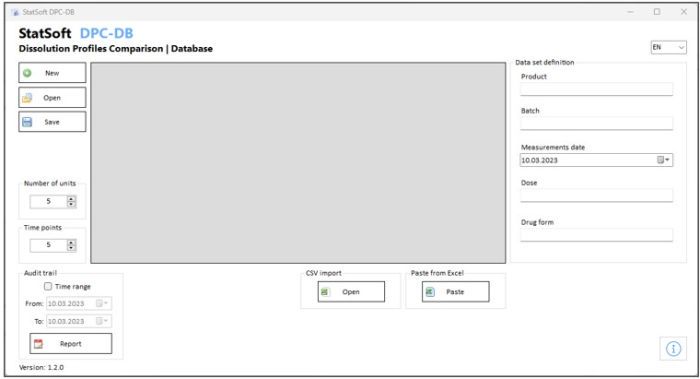
Optionally, the data can be stored in a dedicated database.
The methods used in the module comply to the recommendations of the EU EMA and the US FDA.
The software has been validated according to cGxP requirements.
Main functionalities:
- Model independent methods:
- Similarity factor f2
- Difference factor f1, f1’
- Similarity factor f2 bootstrap
- Similarity factor EXP(f2)
- Multivariate statistical distance using approximate confidence limit (ACLMD)
- Multivariate statistical distance using Hotelling’s T2 statistic (T2EQ)
- Model dependent methods:
- Model parameters comparison using approximate confidence limit (ACLMD)
- Model parameters comparison using Hotelling’s T2 statistic (T2EQ)
- Model parameters comparison using confidence region (CR)
- Dissolution curves comparison using maximum deviation (Dmax)
- Time points truncation according to the rules of EMA, FDA, WHO
- Generation of reports in Word, e-CTD, PDF, Statistica formats
- Configuration of report content with selection of statistical analysis methods
- Creation of templates, containing the configured range of statistical analyses
- Option: saving the results to a database with audit trail


Learn more by watching our webinars for free:
